18 Oct

In the last post, we got a gentle introduction to service mesh. We highlighted some of the benefits adoption of a service mesh bring and why it is almost inescapable as you develop cloud native applications. Today, we will explore Kuma ; one of the several service mesh projects that has been adopted into the CNCF.
Kuma’s website describes the project as an open-source, universal envoy service mesh for distributed service connectivity while delivering high performance and reliability.
Getting started
Kuma can be deployed on bare mental VMs or within a Kubernetes cluster. In this post, we will be focusing on deploying Kuma in a kubernetes cluster. How to obtain a cluster is outside the scope of this blog post, but there are several ways including running a self hosted cluster with minikube , docker desktop or on one of the popular cloud providers like AWS or Azure. We are going to assume you have a kubernetes cluster, kubectl and helm CLIs installed.
First, create the namespace within the cluster to deploy Kuma to$ kubectl create namespace kuma-system
Now use the helm chart provided by the Kuma project to deploy it.
$ helm repo add kuma https://kumahq.github.io/charts
$ helm repo update
$ helm install –namespace kuma-system kuma kuma/kuma
Launch the Kuma GUI by doing a port forward to the control plane. This is a read-only UI, but very helpful for understanding the workloads deployed onto Kuma.
$ kubectl port-forward svc/kuma-control-plane -n kuma-system 5681:5681
Now point your browser to http://localhost:5681/gui . You will be greeted by the welcome screen
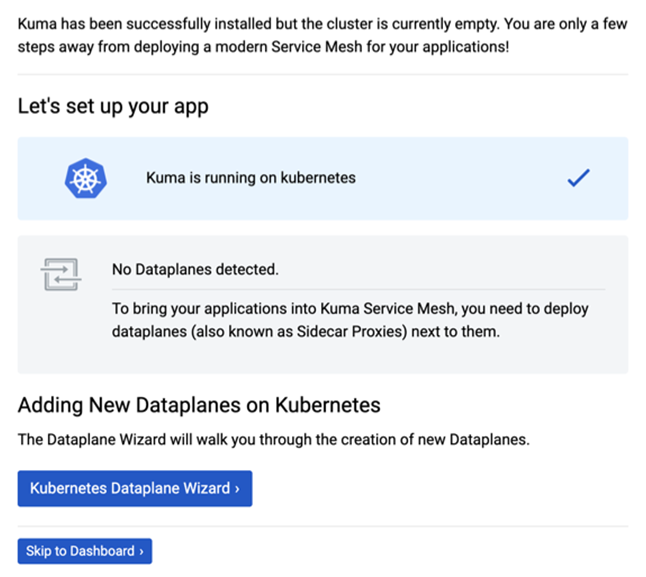
Kuma GUI: First launch
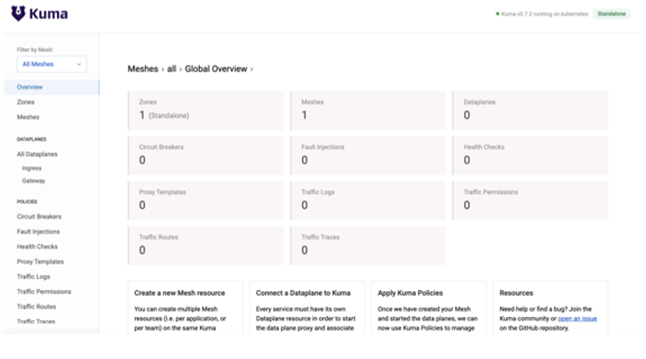
Congrats! At this point, our service mesh is ready to start accepting some workloads, but before we onboard applications, it will be prudent for us to ensure the service mesh has mutual TLS enabled to ensure service-to-service communications are encrypted. By default, Kuma comes with a default mesh with all features mTLS, logging, metrics and tracing are turned off. To turn on mTLS on the default mesh, run the following
$ echo “apiVersion: kuma.io/v1alpha1
kind: Mesh
metadata:
name: default
$ echo “apiVersion: kuma.io/v1alpha1
kind: Mesh
metadata:
name: default
spec:
mtls:
enabledBackend: ca-1
backends:
– name: ca-1
type: builtin” | kubectl apply -f –
Now the mesh is secure, let’s deploy some sample workloads on it. The sample application we will be using is one of the sample applications that comes bundled with Istio (another service mesh project we will cover in an upcoming post). I particularly like the sample application because it helps illustrates several of the benefits microservies and service mesh. The bookinfo sample application is made up of four services all written in different languages all working in concert to bring about application functionality. Here is a flow of service-to-service communications in the application.
Let’s create a namespace that will allow Kuma to automatically inject a sidecar into the pods that are deployed into it. We will deploy the bookinfo sample application into this newly created namespace.
$ echo “apiVersion: v1
kind: Namespace
metadata:
name: blog
namespace: blog
annotations:
kuma.io/sidecar-injection: enabled” | kubectl apply -f –
Deploy the sample application which will create some service accounts, services and deployments. Below is a preview
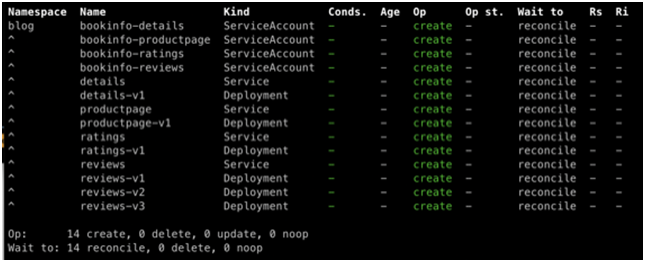
kubectl apply -f https://bit.ly/3dzghY5 -n blog
By default, services are not exposed outside the cluster. So in other to reach our application, we can forward a port on our localhost to the service running in the cluster, just like we did above with the Kuma GUI.
kubectl port-forward productpage-v1-6987489c74-rpqh7 9080:9080
Ensure you replace this with your own product page pod name. Afterwards, you can reach the app at http://localhost:9080/productpage?u=normal. Upon opening the app, you will notice error messages on the landing page. This is due to the fact the mesh has mTLS enabled and service-to-service communications has to be explicitly specified to make successful service calls. This is one is the many value adds of using a service mesh. Let’s go ahead and allow service-to-service communications. Kuma does this with a kubernetes custom resource definition (CRD) called TrafficPermission. In layman’s term, a traffic permission simply instructs the mesh to allow traffic from service A to service B. If a communication from service B to A is also desired, that also needs to be explicitly defined. This allows very fine grain control over which services are allowed to communicate with others. Let’s go ahead add some traffic permissions.
kubectl apply -f https://bit.ly/2HcanjH
This allows all the communications needed between the respective services to allow proper application functionality as illustrated in this diagram.
Now refresh your browser and things you look much better. You should now be able to see book details and associated reviews. We have deployed three versions of the review service and they are all routable, so as you keep refreshing the browser, different versions of review service will be invoked. Those are denoted by no stars, black stars or red stars.
You can read more about traffic permissions here .
Telemetry
Out of the box, Kuma comes with an integration for Prometheus and Grafana. These help collect a wealth of data for deployed services in our mesh. Such metrics are useful for troubleshooting service performance, latency, errors, and communications with other services. Perhaps the best part is that you didn’t don’t need to add any additional code to your services to benefit from such insights. It’s another added benefit of using a service mesh.
To add telemetry to the mesh, run the following:
kubectl apply -f https://bit.ly/31eNJhP
### also add the traffic permissions to allow the metrics pods communicate
kubectl apply -f https://bit.ly/3k5PRQf
Below is a preview of the kubernetes objects that will be deployed into the cluster as a result
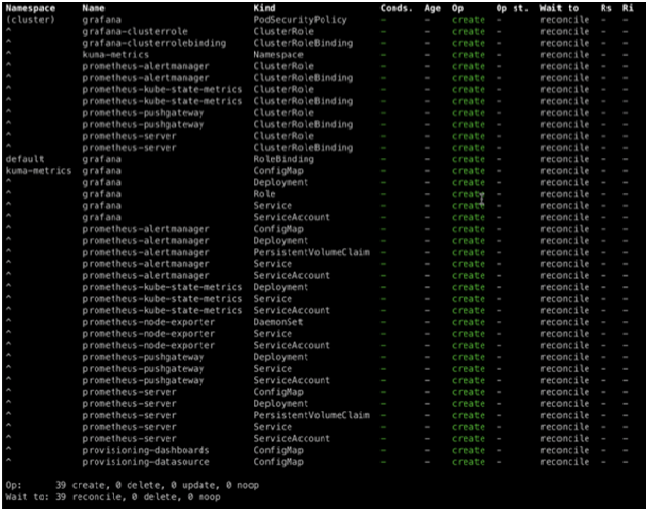
With the metrics components successfully deployed, we can now reach the Grafana dashboard by making it available on our local workstation. Your grafana pod will be running under the kuma-metrics. In my case, grafana pod name is grafana-6b744c8997-8r2xb so I run…
kubectl port-forward grafana-6b744c8997-8r2xb 3000:3000 -n kuma-metrics
(ensure you use the correct name of your grafana pod)
Point your browser to http://localhost:3000 and login with the default credentials admin/admin. As of the time of writing, Kuma comes bundled with 3 separate dashboards; Kuma Mesh, Kuma Dataplane and Kuma Service to Service. The dashboard names are self explanatory and denote which metrics each focus on. You can run some lite load test on the application to seed some data into the dashboard with a tool like jmeter, apache benchmark, locust, etc or simply just refresh your browser for a few seconds.
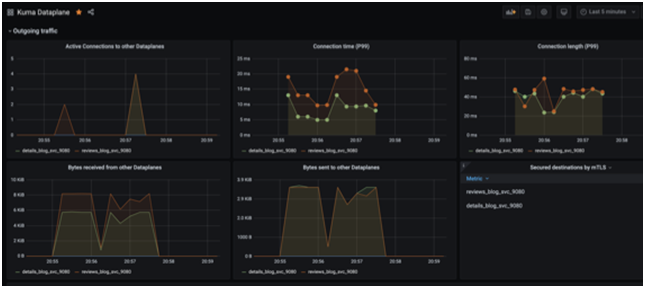
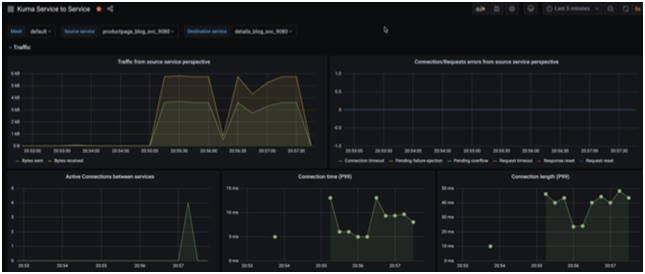
In conclusion, we have barely scratched the surface of all the features Kuma offers in this post. We haven’t explored Traffic Routes, Traffic Logs, Fault Injection, Health Checks, Circuit Breaker, etc. All those features help provide finer grain controls over services helping deliver more secure, resilient, performant and dependable applications and services to your end users.


Recent Comments